Winter Weather Unpacked: How Snow, Sleet, and Ice Form, Why It Matters, and Why Forecasting Them Is One Of The Greatest Meteorological Challenges!
1. The Birth of Winter Precipitation: From Vapor to Ice
At its core, all precipitation begins as invisible water vapor rising from the Earth’s surface. In summer, warm air lifts this vapor upward, it cools, condenses into droplets, and falls as rain. Winter adds a critical twist: the atmosphere often dips below the freezing point of water (0 °C / 32 °F) at various heights, turning the simple rain‑making process into a multi‑stage transformation.
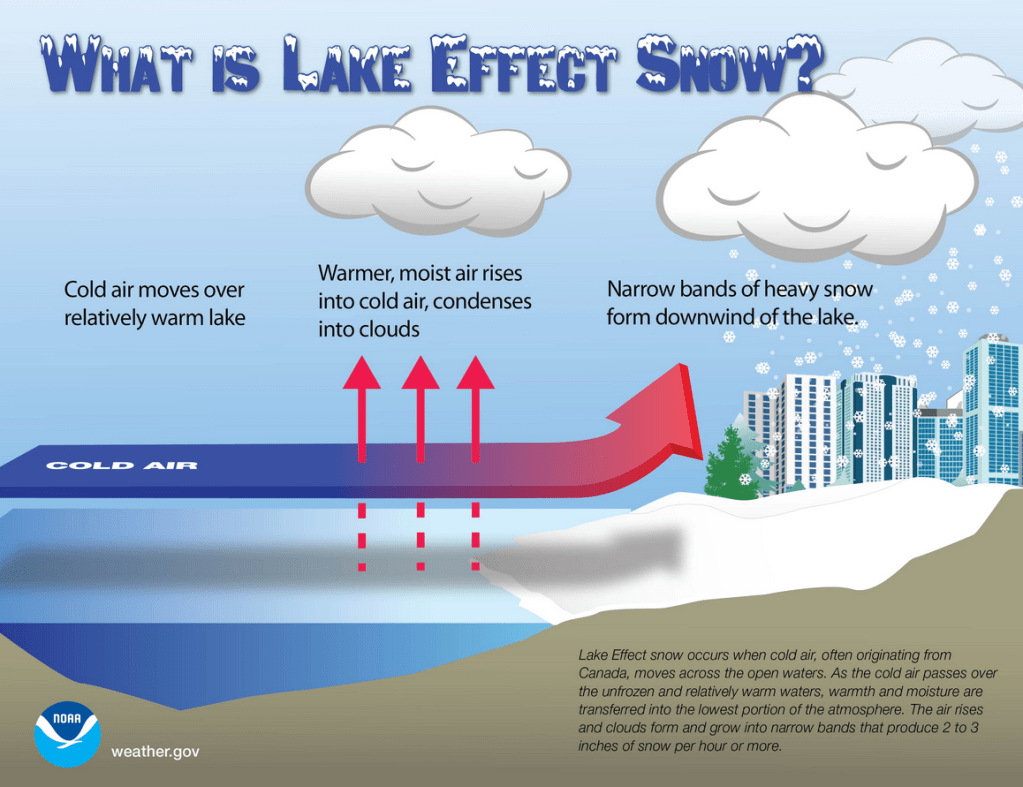
Step 1 – Moisture Ascends: Warm, moist air, often sourced from oceans, lakes, or even heated urban areas, begins its climb. As it rises, it expands and cools, reaching the lifting condensation level where water vapor condenses onto microscopic particles (dust, pollen, sea‑salt). This creates tiny cloud droplets.
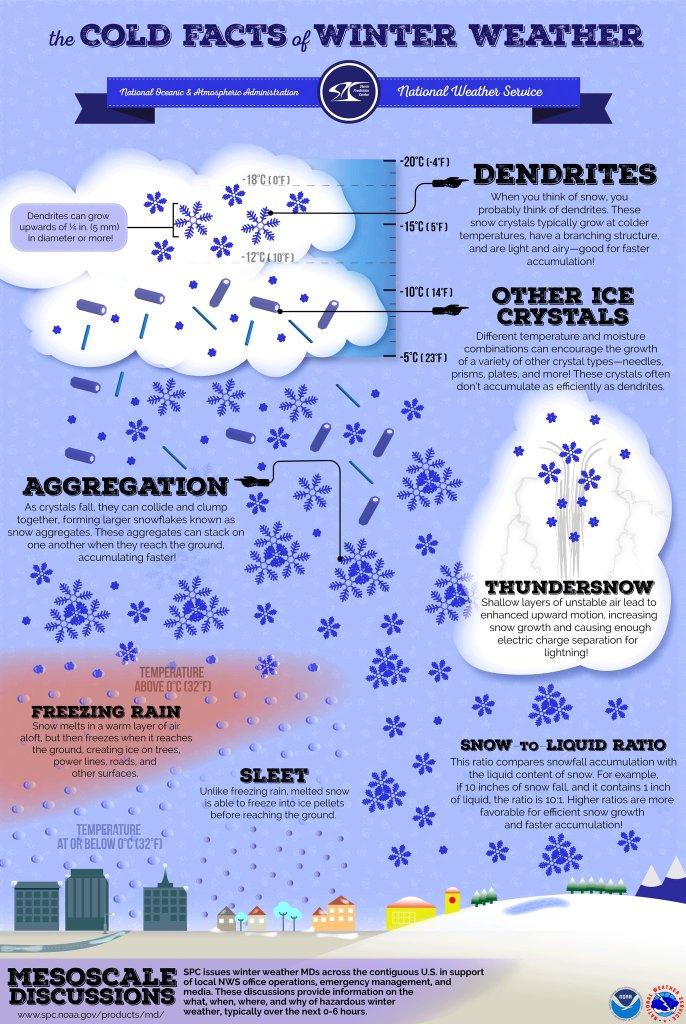
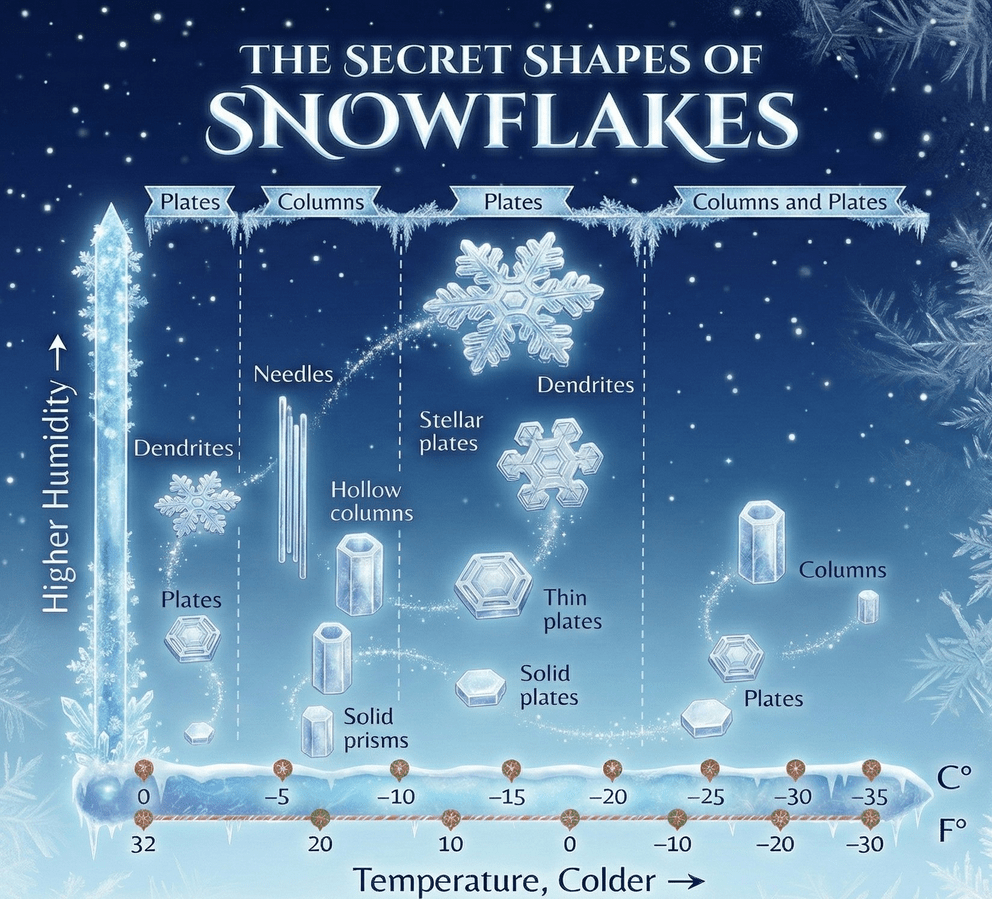
Step 2 – The Cold Encounter: In a winter setting, the rising air soon encounters a layer of sub‑freezing air. If the entire column from cloud base to ground stays below freezing, those droplets freeze directly into ice crystals. These crystals grow by attracting additional water vapor, forming the iconic, six‑armed snowflakes that drift gently to the surface.
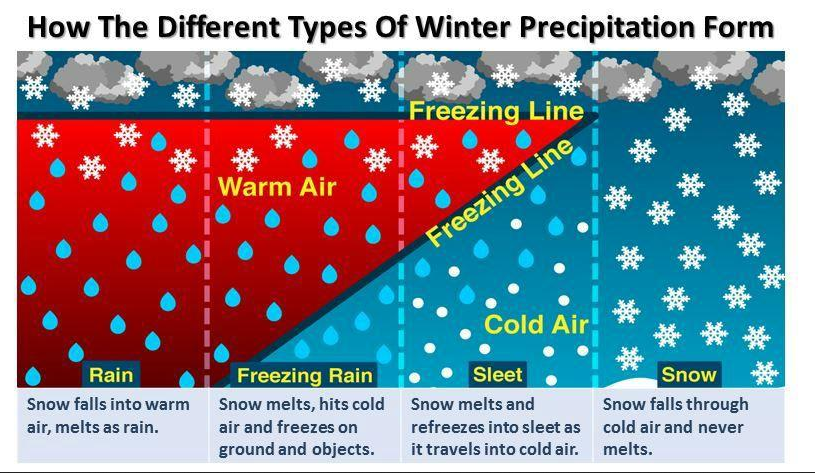
Step 3 – Mixed‑Phase Scenarios: Often, the atmosphere is not uniformly cold. Instead, it contains alternating warm and cold layers. This creates three primary winter precipitation types:
| Temperature Profile | Resulting Precipitation | How It Forms |
|---|---|---|
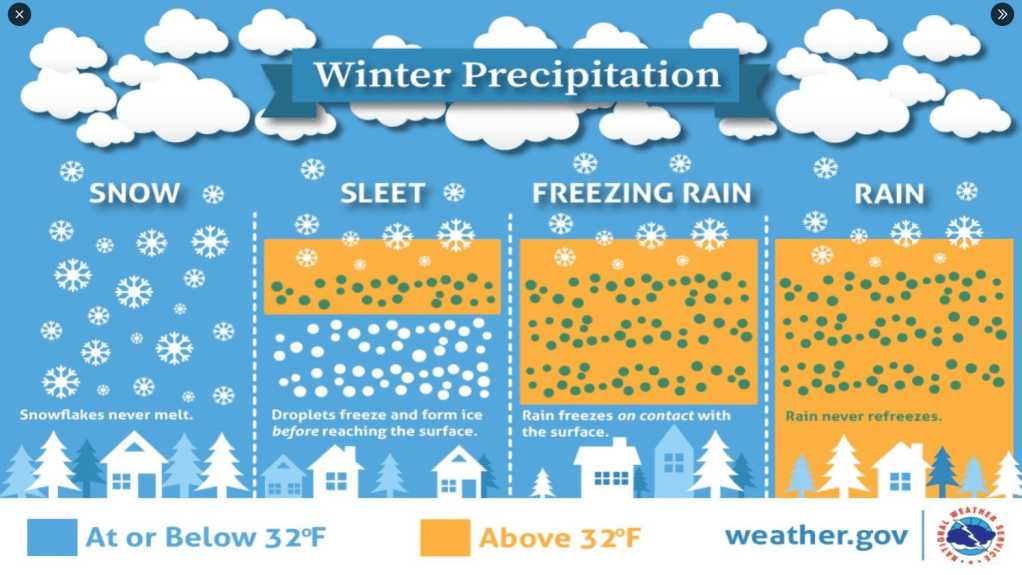
| All‑cold column | Snow | Droplets freeze aloft, become ice crystals, and fall unchanged. |
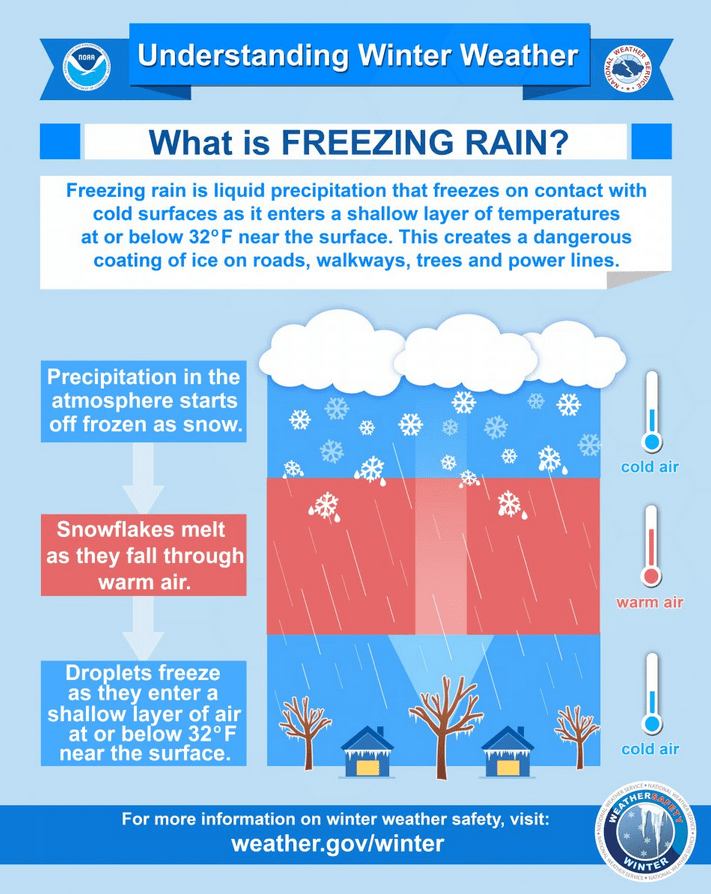
| Warm layer sandwiched between cold layers | Freezing Rain | Drops melt in the warm layer, stay liquid, then instantly freeze on contact with cold surfaces (roads, trees, power lines). |
| Two cold layers with a thin warm slab in between | Sleet (Ice Pellets) | Drops melt in the warm slab, refreeze while falling through the lower cold layer, arriving as small, hard pellets. |
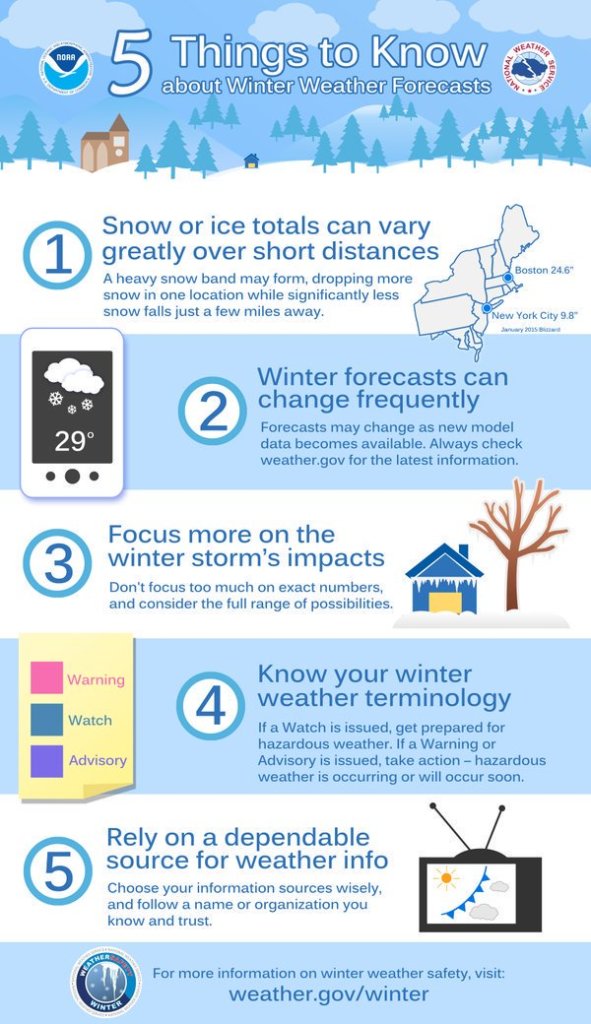
These pathways illustrate why a mere few degrees of temperature difference can dramatically alter what lands on the ground. A storm that looks identical on radar can deliver fluffy snow in one region, a slick coating of ice in another, and harmless rain elsewhere.
2. Why Knowing the Process Is Crucial
Public Safety
Ice storms are notorious for taking down power lines, snapping tree branches, and creating hazardous road conditions. Knowing that a forecast calls for freezing rain gives municipalities time to pre‑position crews, issue travel advisories, and warn residents to protect exposed pipes.
Infrastructure Resilience
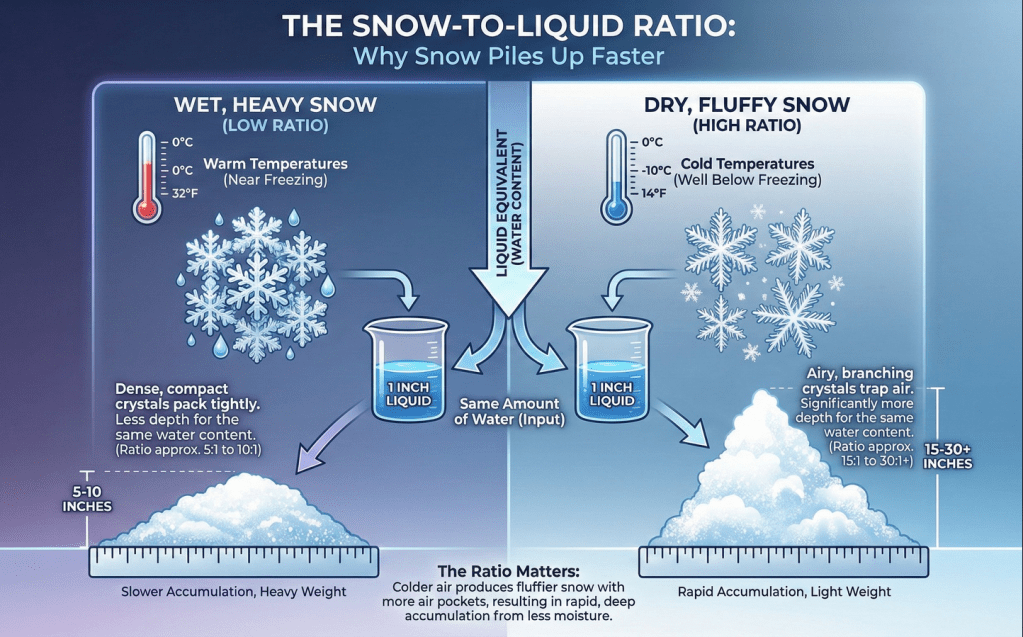
Engineers design roofs, bridges, and drainage systems based on expected snow loads and melt rates. Heavy, wet snow can weigh up to twice as much as dry powder, stressing structures differently. Accurate precipitation type predictions prevent costly over‑design or, worse, structural failure.
Economic Ripple Effects
Airlines, freight companies, and supply chains depend on reliable weather information. A mis‑forecasted ice event can halt flights, delay shipments, and cost millions. Conversely, a well‑timed snow forecast lets cities schedule snow‑plow fleets efficiently, minimizing disruption.
Water Resources
Snow pack serves as a natural reservoir, slowly releasing water during spring melt. Predicting how much snow accumulates, and its density, helps water managers forecast river flows, hydroelectric generation, and flood risk.
Everyday Comfort
For the average person, knowing whether a weekend will bring light snow or a dangerous glaze influences everything from wardrobe choices to holiday travel plans. Clear explanations empower individuals to make informed decisions without feeling overwhelmed.
3. Forecasting Winter Weather: A Different Ballgame
Summer and rain‑focused forecasts primarily answer two questions: Where will precipitation fall? and How much rain will we get? Winter forecasts must juggle a third, decisive variable: temperature profile. A small error in temperature can flip a forecast from “light snow” to “dangerous ice,” dramatically changing the public response.
Key Challenges
- Temperature Sensitivity
Unlike rain, where a few degrees rarely change the outcome, winter precipitation type hinges on temperature gradients that can be less than 2 °C. Accurately modeling the vertical temperature structure, often called the thermal profile, is therefore paramount. - Microphysical Processes
The formation of snow crystals, riming (droplets freezing onto ice particles), and aggregation (snowflakes sticking together) involve complex physics that are still active research areas. Models must approximate these processes, adding uncertainty. - Rapid Phase Changes
A warm front moving in can convert snow to rain within minutes, while a cold snap can reverse the process. Timing these transitions is essential for issuing timely warnings. - Local Topography
Mountains, valleys, and large bodies of water create microclimates. Orographic lifting can enhance snowfall on windward slopes while leaving leeward areas dry. High‑resolution models and localized observations become indispensable.
Tools of the Trade
- Numerical Weather Prediction (NWP) Models: Run on supercomputers, ingesting global data to simulate atmospheric dynamics. For winter, forecasters lean on high‑resolution versions (e.g., the European ECMWF or NOAA’s HRRR) that better resolve temperature layers.
- Radiosondes (Weather Balloons): Provide direct measurements of temperature, humidity, and wind at various altitudes, validating model outputs.
- Satellite Soundings: Infrared and microwave sensors infer temperature profiles across vast regions, filling gaps where balloon launches are sparse.
- Ensemble Forecasting: Running dozens of model simulations with slightly altered starting conditions yields a spread of possible outcomes, highlighting forecast confidence or lack thereof.
By cross‑checking these sources, meteorologists build a layered picture of the atmosphere, allowing them to say, for example, “There is a 70 % chance of a moderate snow event with a 30 % risk of ice accumulation in the northern suburbs.”
4. The Daunting Challenge: Why Winter Is the Meteorologist’s Everest
Winter weather is often described as the most demanding forecasting regime for a reason. It forces forecasters to balance thermodynamics (the temperature dance), microphysics (how ice crystals form and evolve), and local geography all while communicating complex uncertainty in plain language.
A single misstep can have outsized consequences: an unanticipated ice storm may plunge a city into days of blackouts; an over‑cautious ice advisory could unnecessarily shut down schools and businesses. The stakes keep meteorologists on their toes, constantly refining models, seeking better observations, and learning from each event.
Yet this very difficulty also showcases the brilliance of modern meteorology. Turning invisible atmospheric layers into a vivid, actionable story for the public is a skill that blends science, technology, and communication. When a forecaster accurately predicts a sudden shift from snow to freezing rain, they’re not just delivering a weather report, they’re safeguarding lives, protecting infrastructure, and preserving the rhythm of daily life.
5. Winter Weather Infographics
Bottom line: Winter precipitation is a dynamic, multi‑phase phenomenon that demands precise temperature knowledge, sophisticated modeling, a keen knowledge of fluid dynamics, complex mathematical equations, physics, and clear communication. Its forecasts are inherently more complex than those for light rain or summer heat, making winter weather forecasting a daunting test of knowledge and nerves of steel for any meteorologist. With this knowledge, now you’re ready to dive into infographics that illuminate the hidden drama behind every winter storm.
For winter weather safety information, please visit the Winter Weather Preparedness page for a thorough overview of important information!
HOME – SOCIAL MEDIA – ABOUT
WEATHER DATA AND WEATHER SAFETY
™ Tornado Quest © 1998‑2026 Tornado Quest, LLC. All Rights Reserved.

You must be logged in to post a comment.